Text-to-SQL vs Traditional BI: Which is Right for Your Team in 2026?
Business intelligence has been a cornerstone of analytics for more than two decades. Dashboards, reports, and visualizations help organizations track performance, monitor KPIs, and make data-driven decisions.
But a new category of tools has emerged over the last few years: Text-to-SQL platforms.
Instead of opening a dashboard and searching through filters, users simply ask:
“Which products generated the most revenue last quarter?”
The system generates SQL, executes it, and returns an answer.
As AI adoption accelerates, many teams are asking the same question: will Text-to-SQL replace traditional BI tools?
The short answer is no.
The more interesting answer is that both approaches solve different problems — and the most effective organizations are learning to use a combination of both.
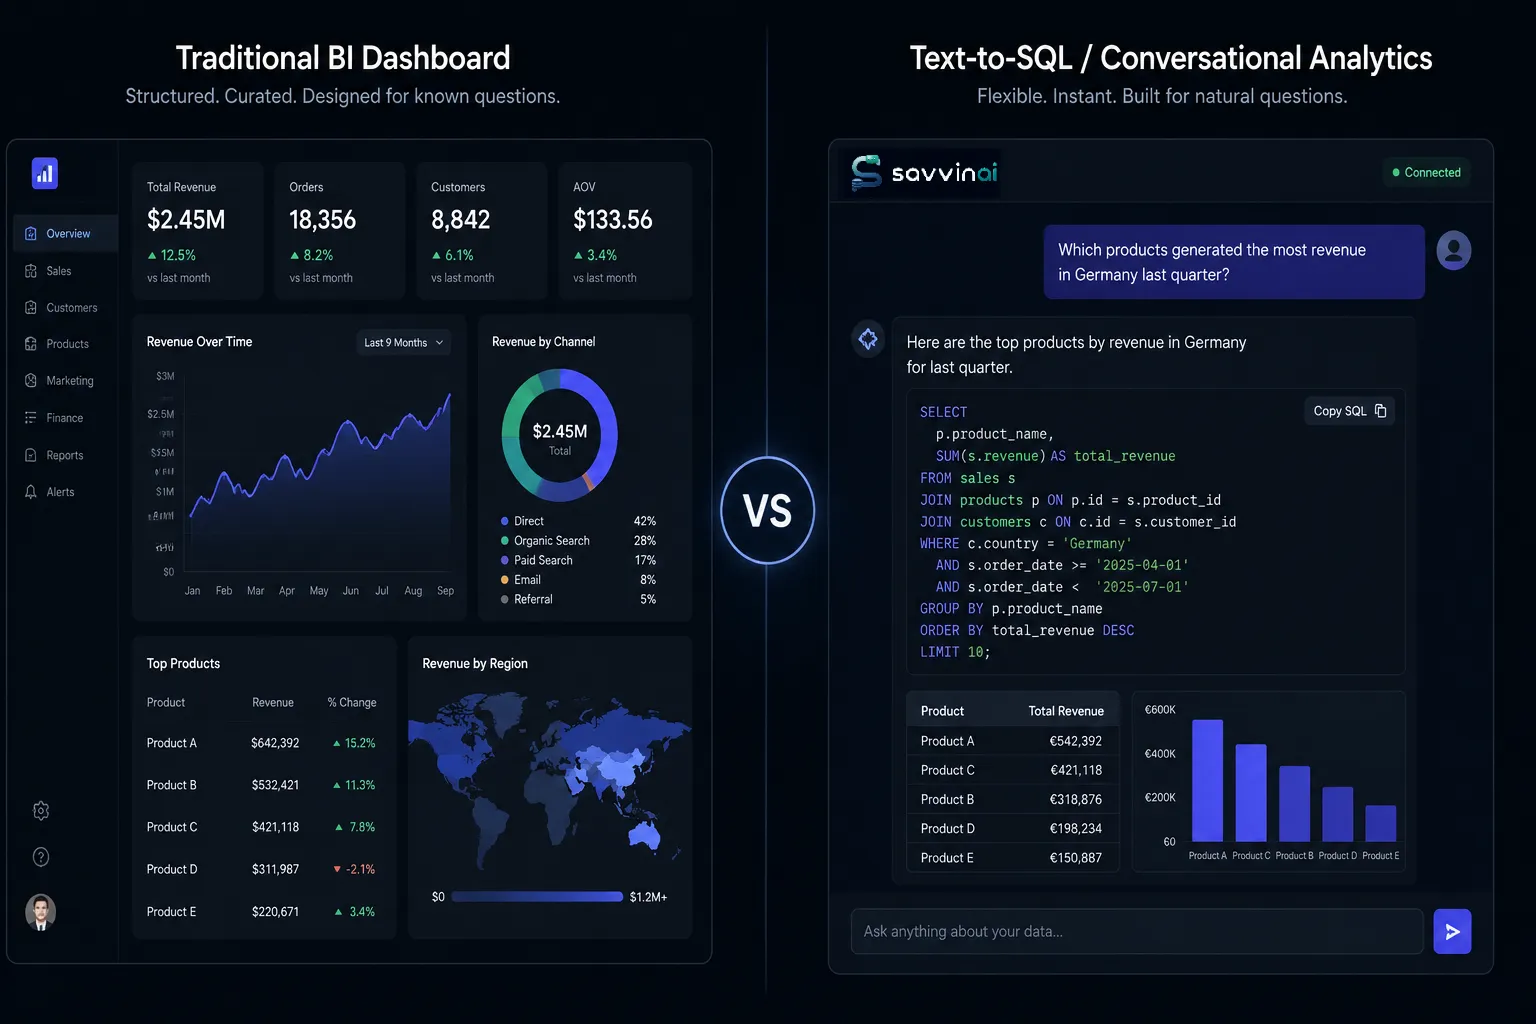
Left: a structured BI dashboard with fixed KPIs and filters. Right: a conversational interface where users simply ask questions and get answers.
What Is Traditional BI?
Traditional Business Intelligence platforms — Microsoft Power BI, Tableau, Looker, Qlik — are designed around predefined dashboards and reports.
A typical workflow looks like this:
- Data engineers build pipelines.
- Analytics engineers create semantic models.
- BI developers design dashboards.
- Business users consume reports.
This model works exceptionally well when KPIs are clearly defined, metrics are standardized, users need recurring reports, and governance is important.
Classic examples include executive scorecards, sales dashboards, customer retention monitoring, and financial reporting. For these use cases, dashboards remain one of the most effective tools available.
What Is Text-to-SQL?
Text-to-SQL allows users to query data using natural language.
Instead of filing a report request, a user asks:
“Which customers generated the most revenue in Germany last month?”
The platform converts the question into SQL, executes it against the database, and returns results.
Modern Text-to-SQL systems combine large language models, database schema understanding, semantic layers, query validation, and security controls. This makes analytics accessible to non-technical users who may not know SQL — which is, in practice, most of the people inside an organization who need data.
The Biggest Problem With Traditional BI
Dashboards answer known questions.
Businesses rarely operate only on known questions.
Consider a marketing manager preparing for a meeting. The dashboard shows revenue, conversions, and campaign performance. But suddenly they need to know:
“Which customers purchased Product A but never upgraded to Product B?”
The dashboard doesn’t contain that analysis. A ticket is opened. A data analyst investigates. A report is created. Hours or days later the answer arrives.
This process repeats thousands of times every year inside large organizations. The cost is not just time — it’s the decisions that were delayed, the opportunities that were missed, and the analysts who spent their day as a reporting help desk instead of doing meaningful work.
The Biggest Problem With Text-to-SQL
Text-to-SQL introduces a different challenge: trust.
A language model may misinterpret business terminology, join tables incorrectly, apply the wrong date logic, or misunderstand metric definitions. Without sufficient business context, even the most capable AI model can generate confident-sounding but incorrect answers.
This is why production-grade systems increasingly rely on semantic models and governance layers rather than exposing raw database schemas directly. The SQL that gets generated is only as trustworthy as the business context the system understands.
This is not a dealbreaker. It is a design constraint — one that serious platforms have largely solved. But it matters enormously when evaluating tools, and it explains why so many Text-to-SQL demos fail to survive contact with real enterprise data.
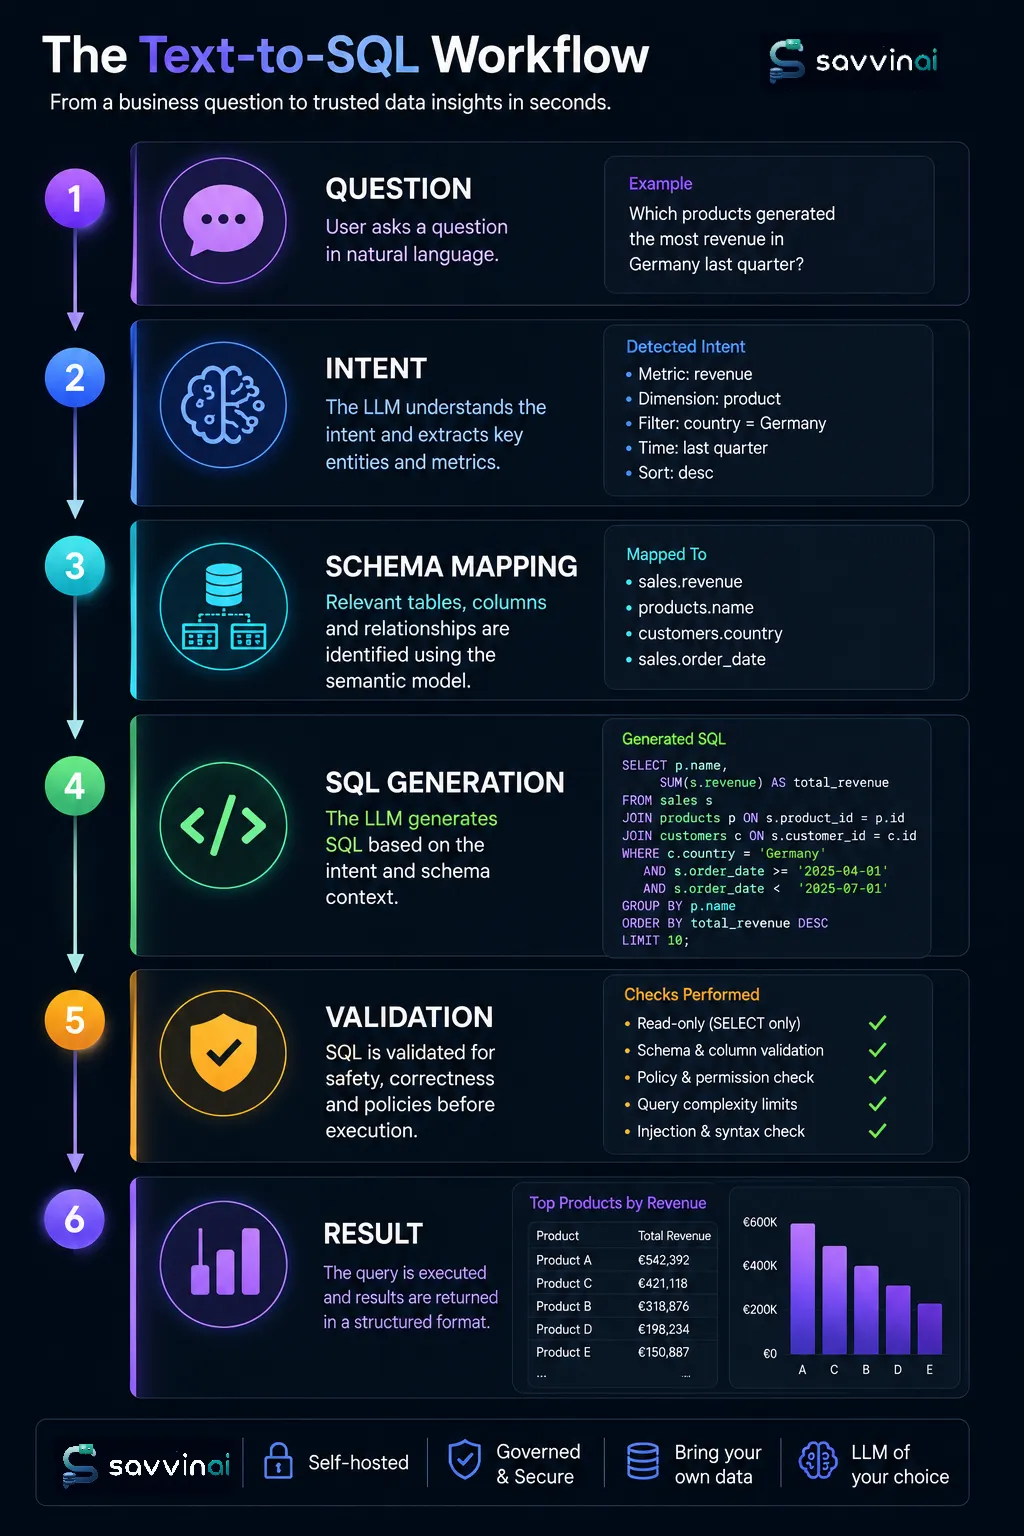
How a modern Text-to-SQL system works: a natural language question passes through intent understanding, schema mapping, SQL generation, and validation before returning a result.
Comparing Text-to-SQL and Traditional BI
| Category | Traditional BI | Text-to-SQL |
|---|---|---|
| Fixed KPI Monitoring | Excellent | Good |
| Ad-hoc Questions | Poor | Excellent |
| Non-Technical Accessibility | Moderate | Excellent |
| Governance | Excellent | Varies |
| Flexibility | Moderate | Excellent |
| Discovering New Insights | Moderate | Excellent |
| Training Required | Moderate | Low |
| Dashboarding | Excellent | Moderate |
The comparison reveals an important insight: these technologies are complementary, not competing.
Traditional BI is structured by design. That structure is its greatest strength for recurring reporting — and its greatest limitation for exploration. Text-to-SQL trades structure for flexibility. Together, they cover the full spectrum of how organizations actually use data.
Why Data Teams Are Paying Attention
Many data engineers and analytics teams spend a surprising proportion of their time answering repetitive reporting requests — questions like “how many customers signed up last month?” or “what was our average order value last quarter?” that often require only a simple query.
Yet those requests interrupt work on data pipelines, data quality, warehouse optimization, semantic modeling, and governance initiatives — the structural work that makes an analytics platform actually reliable over time.
Text-to-SQL can help shift some of this workload toward self-service analytics. Instead of becoming a reporting help desk, data teams can focus on improving the platform itself.
That’s a meaningful change — not just for productivity, but for the quality of the underlying data infrastructure. Teams that aren’t firefighting tend to build better systems.
The Emerging Hybrid Model
The most successful organizations in 2026 are not replacing dashboards. They’re combining dashboards with conversational analytics.
The pattern looks like this:
Dashboards for:
- Weekly reporting and KPI tracking
- Executive reviews
- Regulatory and financial reporting
- Any question that is asked the same way every week
Text-to-SQL for:
- Investigation and exploration
- Ad-hoc and follow-up questions
- Analysis that doesn’t yet have a predefined shape
- Empowering non-technical users to answer their own questions
This hybrid approach gives users the best of both worlds: consistency where consistency matters, flexibility where flexibility is needed.
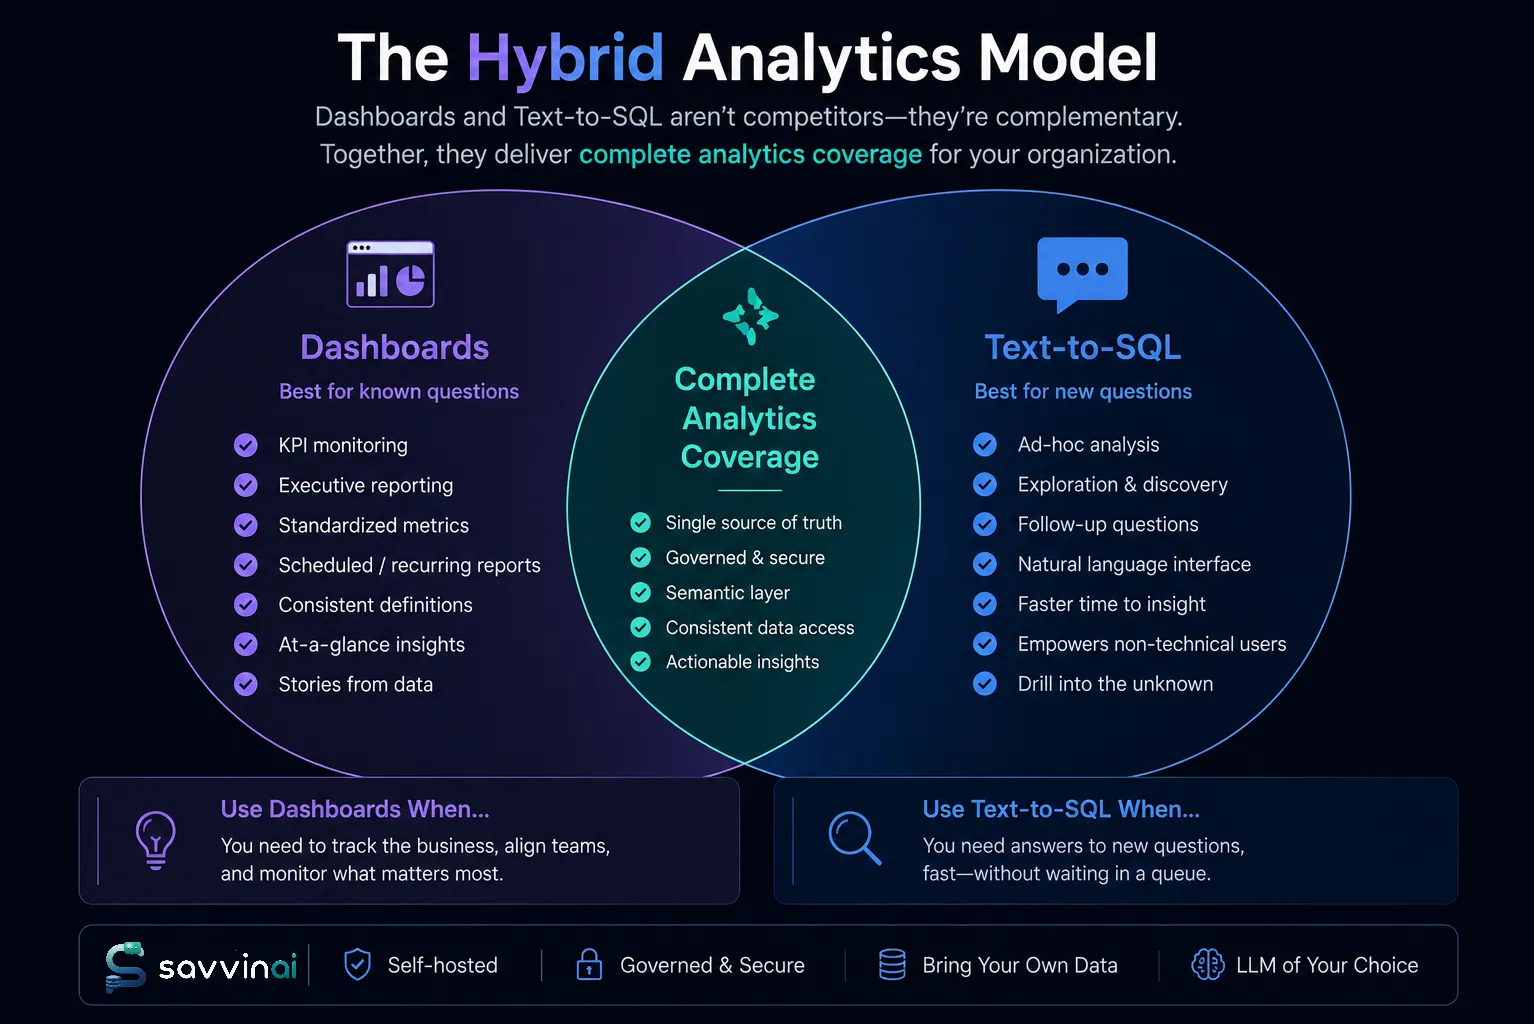
The hybrid model: dashboards handle recurring reporting; Text-to-SQL handles exploration and ad-hoc queries. Together they cover the full spectrum of how organizations use data.
Where Savvina Fits
Savvina is designed around this hybrid model.
Rather than attempting to replace existing BI investments, Savvina adds a conversational analytics layer on top of your existing databases. Business users can ask questions in plain English while your organization maintains governance, security controls, read-only execution, and your existing database infrastructure.
Savvina can be self-hosted in under 15 minutes — which means your data never leaves your infrastructure. There are no cloud pipelines to configure, no data copies to manage, and no third-party access to your warehouse. You keep full control.
This allows teams to experiment with AI-powered analytics without rebuilding their entire reporting stack — and without the compliance headaches that come with sending production data to external APIs.
What Should Your Team Choose?
Choose traditional BI if:
- Most questions are predictable and recurring.
- Dashboards already satisfy the majority of business needs.
- Reporting consistency and governance are the primary goals.
Choose Text-to-SQL if:
- Users frequently ask new or exploratory questions.
- Ad-hoc reporting is consuming significant analyst time.
- Self-service analytics is a strategic priority.
Choose both if:
- You want structured reporting and the ability to explore beyond it.
For most organizations in 2026, the third option is becoming the default — not because it’s fashionable, but because it reflects how people actually work with data.
Final Thoughts
Traditional BI is not disappearing. Dashboards remain one of the most effective ways to monitor business performance at scale, and nothing in the current wave of AI tools changes that.
At the same time, Text-to-SQL is fundamentally changing how users interact with data — making analytics more conversational, more accessible, and less dependent on technical gatekeepers.
The future is not dashboards or AI. It’s dashboards and AI working together: structured reporting where you need consistency, conversational analytics where you need to explore.
Organizations that successfully combine governance, semantic modeling, and natural language querying will be best positioned to make data-driven decisions at scale — and to do so without building a second data team just to serve the first one.